
[Applause] well thank you very much for that
well thank you very much for that
well thank you very much for that introduction and thank you very much for
introduction and thank you very much for
introduction and thank you very much for making me a professor I’m only an
making me a professor I’m only an
making me a professor I’m only an assistant professor but professors
assistant professor but professors
assistant professor but professors sounds good
sounds good
sounds good I’ll keep it so I’m very glad and very
I’ll keep it so I’m very glad and very
I’ll keep it so I’m very glad and very honored to be here today and I do that’s
honored to be here today and I do that’s
honored to be here today and I do that’s my educational background but nowadays I
my educational background but nowadays I
my educational background but nowadays I actually what I do most is education I’m
actually what I do most is education I’m
actually what I do most is education I’m a teacher and I teach global health and
a teacher and I teach global health and
a teacher and I teach global health and I am a teacher really really like
I am a teacher really really like
I am a teacher really really like statistics just like you said and I’m
statistics just like you said and I’m
statistics just like you said and I’m into numbers and graphs so I just come
into numbers and graphs so I just come
into numbers and graphs so I just come in here to this places it’s like heaven
in here to this places it’s like heaven
in here to this places it’s like heaven I can teach you global health and I can
I can teach you global health and I can
I can teach you global health and I can use my graphs and you may be like them
use my graphs and you may be like them
use my graphs and you may be like them and so teaching global health is trying
and so teaching global health is trying
and so teaching global health is trying to show you how health varies globally
to show you how health varies globally
to show you how health varies globally how health varies in the world how
how health varies in the world how
how health varies in the world how health varies between countries and I
health varies between countries and I
health varies between countries and I will do that today showing you only one
will do that today showing you only one
will do that today showing you only one graph but I will also show you how
graph but I will also show you how
graph but I will also show you how health the differs not only between
health the differs not only between
health the differs not only between countries but within countries between
countries but within countries between
countries but within countries between majority and minority populations and
majority and minority populations and
majority and minority populations and knowing the background knowing what
knowing the background knowing what
knowing the background knowing what things look like when it comes to health
things look like when it comes to health
things look like when it comes to health is a good condition or is a condition to
is a good condition or is a condition to
is a good condition or is a condition to then start talk about integration you
then start talk about integration you
then start talk about integration you need to have the basic facts first so I
need to have the basic facts first so I
need to have the basic facts first so I said I would talk about health what is
said I would talk about health what is
said I would talk about health what is health it’s health just the opposite of
health it’s health just the opposite of
health it’s health just the opposite of disease the opposite of death there is
disease the opposite of death there is
disease the opposite of death there is quite a clear w/o definition health is a
quite a clear w/o definition health is a
quite a clear w/o definition health is a state of complete physical mental and
state of complete physical mental and
state of complete physical mental and social well-being I take it again health
social well-being I take it again health
social well-being I take it again health is a state of complete physical mental
is a state of complete physical mental
is a state of complete physical mental and social well-being have you ever been
and social well-being have you ever been
and social well-being have you ever been in perfect health according to that
in perfect health according to that
in perfect health according to that definition I have once
definition I have once
definition I have once let me tell you when that was it was
let me tell you when that was it was
let me tell you when that was it was actually my last few days in high school
actually my last few days in high school
actually my last few days in high school just before I was to graduate I was on
just before I was to graduate I was on
just before I was to graduate I was on my way to school
my way to school
my way to school biking biking down a hill the Sun was in
biking biking down a hill the Sun was in
biking biking down a hill the Sun was in the air the birds were singing it was
the air the birds were singing it was
the air the birds were singing it was quite warm and I was so happy I knew it
quite warm and I was so happy I knew it
quite warm and I was so happy I knew it was really my last days of school and as
was really my last days of school and as
was really my last days of school and as I was biking down this hill with the air
I was biking down this hill with the air
I was biking down this hill with the air in my hair that was before I became an
in my hair that was before I became an
in my hair that was before I became an adult started using a bike helmet
adult started using a bike helmet
adult started using a bike helmet I really felt exactly like that like
I really felt exactly like that like
I really felt exactly like that like that definition I was in perfect health
that definition I was in perfect health
that definition I was in perfect health and then at the bottom of the hill there
and then at the bottom of the hill there
and then at the bottom of the hill there was this tiny little patch of gravel you
was this tiny little patch of gravel you
was this tiny little patch of gravel you know that those little patches of gravel
know that those little patches of gravel
know that those little patches of gravel that are still there after the winter
that are still there after the winter
that are still there after the winter and I didn’t see it so I was turning
and I didn’t see it so I was turning
and I didn’t see it so I was turning just wear that patch was of gravel and I
just wear that patch was of gravel and I
just wear that patch was of gravel and I slipped and I fell and I hurt my knee I
slipped and I fell and I hurt my knee I
slipped and I fell and I hurt my knee I didn’t hurt myself that but my I
didn’t hurt myself that but my I
didn’t hurt myself that but my I scratched my bike so I was really
scratched my bike so I was really
scratched my bike so I was really worried what would my parents say how
worried what would my parents say how
worried what would my parents say how was I to afford to fix the bike and just
was I to afford to fix the bike and just
was I to afford to fix the bike and just like that within less than one second
like that within less than one second
like that within less than one second I lost my perfect state of health now I
I lost my perfect state of health now I
I lost my perfect state of health now I hope you have all yourself try to
hope you have all yourself try to
hope you have all yourself try to remember when you were in perfect health
remember when you were in perfect health
remember when you were in perfect health anyone in perfect health tonight no okay
anyone in perfect health tonight no okay
anyone in perfect health tonight no okay maybe that’s that um but how do we
maybe that’s that um but how do we
maybe that’s that um but how do we measure health should we measure it as
measure health should we measure it as
measure health should we measure it as just the absence of the disease or death
just the absence of the disease or death
just the absence of the disease or death or should we try to go more for the wgo
or should we try to go more for the wgo
or should we try to go more for the wgo definition which would be more something
definition which would be more something
definition which would be more something like the dross National Happiness index
like the dross National Happiness index
like the dross National Happiness index that is popular in Bhutan well actually
that is popular in Bhutan well actually
that is popular in Bhutan well actually in global health we go for something in
in global health we go for something in
in global health we go for something in between we use average life expectancy
between we use average life expectancy
between we use average life expectancy an average life expectancy is an
an average life expectancy is an
an average life expectancy is an interesting measure it is the average
interesting measure it is the average
interesting measure it is the average life expectancy of let’s take a baby
life expectancy of let’s take a baby
life expectancy of let’s take a baby born in Sweden today in Stockholm today
born in Sweden today in Stockholm today
born in Sweden today in Stockholm today maybe a dumbbell where I spend half of
maybe a dumbbell where I spend half of
maybe a dumbbell where I spend half of my time so we have a baby born today and
my time so we have a baby born today and
my time so we have a baby born today and it’s a girl
it’s a girl
it’s a girl this baby girl can expect to live on
this baby girl can expect to live on
this baby girl can expect to live on average 84 years if you spurn today
average 84 years if you spurn today
average 84 years if you spurn today which is pretty amazing 84 years 8 years
which is pretty amazing 84 years 8 years
which is pretty amazing 84 years 8 years if it’s a boy which is still pretty good
if it’s a boy which is still pretty good
if it’s a boy which is still pretty good so the average life expectancy for
so the average life expectancy for
so the average life expectancy for Sweden is 8 to 2 years today that is for
Sweden is 8 to 2 years today that is for
Sweden is 8 to 2 years today that is for a baby born today if all the conditions
a baby born today if all the conditions
a baby born today if all the conditions remain the same conditions never remain
remain the same conditions never remain
remain the same conditions never remain the same we all have technological
the same we all have technological
the same we all have technological improvements we have sometimes we have
improvements we have sometimes we have
improvements we have sometimes we have epidemics that strike like the Spanish
epidemics that strike like the Spanish
epidemics that strike like the Spanish flu we have amazing medical discoveries
flu we have amazing medical discoveries
flu we have amazing medical discoveries with new cures but if all everything
with new cures but if all everything
with new cures but if all everything remains the same today that is what we
remains the same today that is what we
remains the same today that is what we call the average life expectancy and it
call the average life expectancy and it
call the average life expectancy and it is quite a good measure of what type of
is quite a good measure of what type of
is quite a good measure of what type of health and health care we can offer the
health and health care we can offer the
health and health care we can offer the baby born in Sweden today so with what
baby born in Sweden today so with what
baby born in Sweden today so with what we have today on average this little
we have today on average this little
we have today on average this little baby girl will live 84 years so average
baby girl will live 84 years so average
baby girl will live 84 years so average life expectancy that is it’s not a
life expectancy that is it’s not a
life expectancy that is it’s not a perfect measure we don’t know exactly
perfect measure we don’t know exactly
perfect measure we don’t know exactly that it is 80 4.03 in Sweden but it’s
that it is 80 4.03 in Sweden but it’s
that it is 80 4.03 in Sweden but it’s around there plus – and when we want to
around there plus – and when we want to
around there plus – and when we want to see the big picture we want to compare
see the big picture we want to compare
see the big picture we want to compare between countries it’s a good enough
between countries it’s a good enough
between countries it’s a good enough measure so now I’ve introduced you to
measure so now I’ve introduced you to
measure so now I’ve introduced you to health and perfect health and how we
health and perfect health and how we
health and perfect health and how we measure health now it’s time to show you
measure health now it’s time to show you
measure health now it’s time to show you my graph you might have seen this graph
my graph you might have seen this graph
my graph you might have seen this graph before because this is a Gapminder graph
before because this is a Gapminder graph
before because this is a Gapminder graph and it has been shown by Hans Rosling
and it has been shown by Hans Rosling
and it has been shown by Hans Rosling ruler rustling I’m not willing and the
ruler rustling I’m not willing and the
ruler rustling I’m not willing and the other Gapminder professionals before but
other Gapminder professionals before but
other Gapminder professionals before but let me take you through it and to do
let me take you through it and to do
let me take you through it and to do that I need a stick to show you properly
that I need a stick to show you properly
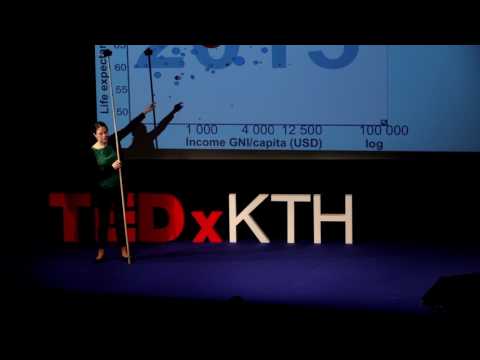
that I need a stick to show you properly so this is the whole world in one graph
so this is the whole world in one graph
so this is the whole world in one graph on the vertical axis we have average
on the vertical axis we have average
on the vertical axis we have average life expectancy because it ranges from
life expectancy because it ranges from
life expectancy because it ranges from 50 all the way up to 80 of there even
50 all the way up to 80 of there even
50 all the way up to 80 of there even 82.5 and then on this axis on the
82.5 and then on this axis on the
82.5 and then on this axis on the horizontal axis we have income per
horizontal axis we have income per
horizontal axis we have income per capita so it goes all the way from Z
capita so it goes all the way from Z
capita so it goes all the way from Z after 100,000 on a log scale and then we
after 100,000 on a log scale and then we
after 100,000 on a log scale and then we have all the bubbles here which
have all the bubbles here which
have all the bubbles here which represents countries of the world there
represents countries of the world there
represents countries of the world there are about 200 countries in the world
are about 200 countries in the world
are about 200 countries in the world there about 200 bubbles in this chart so
there about 200 bubbles in this chart so
there about 200 bubbles in this chart so each bubble represents a country and the
each bubble represents a country and the
each bubble represents a country and the size of the bubble represents the size
size of the bubble represents the size
size of the bubble represents the size of the population of the country big
of the population of the country big
of the population of the country big bubble means big population and then we
bubble means big population and then we
bubble means big population and then we have the color of the bubble which
have the color of the bubble which
have the color of the bubble which represents what region the country
represents what region the country
represents what region the country belongs to and you have the green
belongs to and you have the green
belongs to and you have the green countries you have the map over there so
countries you have the map over there so
countries you have the map over there so you can see but you have all the green
you can see but you have all the green
you can see but you have all the green countries they are the Americas you have
countries they are the Americas you have
countries they are the Americas you have the yellow countries European countries
the yellow countries European countries
the yellow countries European countries the blue bubbles they are African
the blue bubbles they are African
the blue bubbles they are African countries and the red ones are Asian
countries and the red ones are Asian
countries and the red ones are Asian countries and with these facts you
countries and with these facts you
countries and with these facts you should be able to figure out the two big
should be able to figure out the two big
should be able to figure out the two big red bubbles this one and this one they
red bubbles this one and this one they
red bubbles this one and this one they are Indian China so when we look at this
are Indian China so when we look at this
are Indian China so when we look at this you can see that there’s a clear
you can see that there’s a clear
you can see that there’s a clear relation between how rich a country is
relation between how rich a country is
relation between how rich a country is and how long people live in that country
and how long people live in that country
and how long people live in that country how healthy they are in that country
how healthy they are in that country
how healthy they are in that country right because there are no countries up
right because there are no countries up
right because there are no countries up here that live long and have no money
here that live long and have no money
here that live long and have no money and there are no countries down here
and there are no countries down here
and there are no countries down here that have a lot of money but but do not
that have a lot of money but but do not
that have a lot of money but but do not live long there’s a clear relation
live long there’s a clear relation
live long there’s a clear relation between health and money right but to
between health and money right but to
between health and money right but to make some kind of to make it more
make some kind of to make it more
make some kind of to make it more comprehensible when we show this graph
comprehensible when we show this graph
comprehensible when we show this graph and we use it we want to divide the
and we use it we want to divide the
and we use it we want to divide the world into categories so we can talk
world into categories so we can talk
world into categories so we can talk about countries in the same cattery
about countries in the same cattery
about countries in the same cattery category we can compare it with
category we can compare it with
category we can compare it with countries in other categories and before
countries in other categories and before
countries in other categories and before in the old times maybe what you learnt
in the old times maybe what you learnt
in the old times maybe what you learnt is cool we talked about developing
is cool we talked about developing
is cool we talked about developing countries and developed countries can
countries and developed countries can
countries and developed countries can you draw a line here and tell me where
you draw a line here and tell me where
you draw a line here and tell me where that line is when does a country cross
that line is when does a country cross
that line is when does a country cross the line of becoming a developed country
the line of becoming a developed country
the line of becoming a developed country is it here
is it here
is it here is it here is it here can’t really say
is it here is it here can’t really say
is it here is it here can’t really say can you there’s no really intuitive way
can you there’s no really intuitive way
can you there’s no really intuitive way of doing it is it that we don’t use the
of doing it is it that we don’t use the
of doing it is it that we don’t use the terms developing and developed anymore
terms developing and developed anymore
terms developing and developed anymore but somehow they these this terminology
but somehow they these this terminology
but somehow they these this terminology has been so popular that it has stuck
has been so popular that it has stuck
has been so popular that it has stuck and you will meet it everywhere even
and you will meet it everywhere even
and you will meet it everywhere even within global health people still use it
within global health people still use it
within global health people still use it but in official terms the World Bank for
but in official terms the World Bank for
but in official terms the World Bank for instance they don’t use it anymore so
instance they don’t use it anymore so
instance they don’t use it anymore so hopefully more and more we’re gonna
hopefully more and more we’re gonna
hopefully more and more we’re gonna leave this terminology behind instead
leave this terminology behind instead
leave this terminology behind instead what we do is we use World Bank income
what we do is we use World Bank income
what we do is we use World Bank income categories and when we do that all the
categories and when we do that all the
categories and when we do that all the countries that have an income above
countries that have an income above
countries that have an income above $12,500 become high-income countries 1
$12,500 become high-income countries 1
$12,500 become high-income countries 1 billion people live in high-income
billion people live in high-income
billion people live in high-income countries and here you find a big green
countries and here you find a big green
countries and here you find a big green bubble that’s the u.s. a big red bubble
bubble that’s the u.s. a big red bubble
bubble that’s the u.s. a big red bubble Japan and most of the yellow bubbles
Japan and most of the yellow bubbles
Japan and most of the yellow bubbles European countries then we have the
European countries then we have the
European countries then we have the upper middle income countries with 2.5
upper middle income countries with 2.5
upper middle income countries with 2.5 billion people how many people are there
billion people how many people are there
billion people how many people are there in the world about 7 so 2.5 billion
in the world about 7 so 2.5 billion
in the world about 7 so 2.5 billion people live in upper middle-income
people live in upper middle-income
people live in upper middle-income countries and here we can find a country
countries and here we can find a country
countries and here we can find a country like China and then we come to the lower
like China and then we come to the lower
like China and then we come to the lower middle-income countries where another
middle-income countries where another
middle-income countries where another 2.5 billion people live and here you can
2.5 billion people live and here you can
2.5 billion people live and here you can find a country like India and finally
find a country like India and finally
find a country like India and finally the last billion live in low-income
the last billion live in low-income
the last billion live in low-income countries where you find a country like
countries where you find a country like
countries where you find a country like the Democratic Republic of Congo so four
the Democratic Republic of Congo so four
the Democratic Republic of Congo so four categories and most of the people most
categories and most of the people most
categories and most of the people most of the 7 billion 5 billion they live in
of the 7 billion 5 billion they live in
of the 7 billion 5 billion they live in the middle there’s 1 billion of their
the middle there’s 1 billion of their
the middle there’s 1 billion of their high income there’s 1 billion down here
high income there’s 1 billion down here
high income there’s 1 billion down here low but most people live in the middle
ok but you cannot see that even though
ok but you cannot see that even though there are clear differences between the
there are clear differences between the
there are clear differences between the categories there are also differences
categories there are also differences
categories there are also differences within each category you can take a
within each category you can take a
within each category you can take a country in the lower middle income
country in the lower middle income
country in the lower middle income category here like Vietnam and
category here like Vietnam and
category here like Vietnam and parrot to Nigeria down here they have
parrot to Nigeria down here they have
parrot to Nigeria down here they have almost the same income but very
almost the same income but very
almost the same income but very different life expectancies so I said
different life expectancies so I said
different life expectancies so I said there’s a clear relation but it seems to
there’s a clear relation but it seems to
there’s a clear relation but it seems to be important what you do with the money
be important what you do with the money
be important what you do with the money that you have so just to show you the
that you have so just to show you the
that you have so just to show you the average life expectancy in low-income
average life expectancy in low-income
average life expectancy in low-income countries it’s 61 in lower middle
countries it’s 61 in lower middle
countries it’s 61 in lower middle 67 in upper middle 74 and in high-income
67 in upper middle 74 and in high-income
67 in upper middle 74 and in high-income countries 81 so very close to the
countries 81 so very close to the
countries 81 so very close to the Swedish average and Sweden is one of the
Swedish average and Sweden is one of the
Swedish average and Sweden is one of the it’s actually the yellow bubble up there
it’s actually the yellow bubble up there
it’s actually the yellow bubble up there it’s 82 and now you have the world in
it’s 82 and now you have the world in
it’s 82 and now you have the world in front of you now what we’re going to do
front of you now what we’re going to do
front of you now what we’re going to do we are going to look at countries and
we are going to look at countries and
we are going to look at countries and within countries and compare majority
within countries and compare majority
within countries and compare majority and minority populations so let’s see
and minority populations so let’s see
and minority populations so let’s see let’s start with the u.s. in the u.s.
let’s start with the u.s. in the u.s.
let’s start with the u.s. in the u.s. there are quite a few minorities I will
there are quite a few minorities I will
there are quite a few minorities I will only take a look at the indigenous
only take a look at the indigenous
only take a look at the indigenous population of the US and the u.s. in the
population of the US and the u.s. in the
population of the US and the u.s. in the average life expectancy in the u.s. is
average life expectancy in the u.s. is
average life expectancy in the u.s. is 79 years the indigenous population in
79 years the indigenous population in
79 years the indigenous population in the US has a life expectancy of 74 it’s
the US has a life expectancy of 74 it’s
the US has a life expectancy of 74 it’s about five years lower it’s this typical
about five years lower it’s this typical
about five years lower it’s this typical only for the u.s. let’s take a look at a
only for the u.s. let’s take a look at a
only for the u.s. let’s take a look at a few other high-income countries with
few other high-income countries with
few other high-income countries with minority populations first you take a
minority populations first you take a
minority populations first you take a look at Denmark our neighboring country
look at Denmark our neighboring country
look at Denmark our neighboring country which has within the Kingdom of Denmark
which has within the Kingdom of Denmark
which has within the Kingdom of Denmark you can find the autonomous country of
you can find the autonomous country of
you can find the autonomous country of Greenland which is a huge island in the
Greenland which is a huge island in the
Greenland which is a huge island in the Arctic and about 1% of the population in
Arctic and about 1% of the population in
Arctic and about 1% of the population in all of Denmark lives in Greenland and
all of Denmark lives in Greenland and
all of Denmark lives in Greenland and most of them are into it life expectance
most of them are into it life expectance
most of them are into it life expectance in Denmark is 80 and in Greenland it’s
in Denmark is 80 and in Greenland it’s
in Denmark is 80 and in Greenland it’s 72 so 8 years difference
finally take a look at Australia in
finally take a look at Australia in Australia we have the same life
Australia we have the same life
Australia we have the same life expectancy as a Sweden it’s 82 and the
expectancy as a Sweden it’s 82 and the
expectancy as a Sweden it’s 82 and the indigenous population of Australia it’s
indigenous population of Australia it’s
indigenous population of Australia it’s 10 years less 10-year of a difference
10 years less 10-year of a difference
10 years less 10-year of a difference here so why do even though we have
here so why do even though we have
here so why do even though we have Australia we have Denmark we have the US
Australia we have Denmark we have the US
Australia we have Denmark we have the US why do the indigenous populations of
why do the indigenous populations of
why do the indigenous populations of these countries lives much shorter than
these countries lives much shorter than
these countries lives much shorter than the majority populations they’re very
the majority populations they’re very
the majority populations they’re very tiny parts of the countries in a whole
tiny parts of the countries in a whole
tiny parts of the countries in a whole they make up 1 to 3 percent of the
they make up 1 to 3 percent of the
they make up 1 to 3 percent of the population but why do they live so much
population but why do they live so much
population but why do they live so much shorter there seems to be something
shorter there seems to be something
shorter there seems to be something happening with integration into modern
happening with integration into modern
happening with integration into modern life there seems to be consequences of
life there seems to be consequences of
life there seems to be consequences of it so if you go to look to see what the
it so if you go to look to see what the
it so if you go to look to see what the causes of disease and death are in these
causes of disease and death are in these
causes of disease and death are in these indigenous populations you will find out
indigenous populations you will find out
indigenous populations you will find out that the rates of alcohol related
that the rates of alcohol related
that the rates of alcohol related diseases are much higher in indigenous
diseases are much higher in indigenous
diseases are much higher in indigenous populations and also that suicide rates
populations and also that suicide rates
populations and also that suicide rates are much higher indigenous populations
are much higher indigenous populations
are much higher indigenous populations there also seems to be diseases related
there also seems to be diseases related
there also seems to be diseases related to too little integration and that is
to too little integration and that is
to too little integration and that is what do I mean by that – little
what do I mean by that – little
what do I mean by that – little integration that with that I mean infant
integration that with that I mean infant
integration that with that I mean infant mortality child mortality is somewhat
mortality child mortality is somewhat
mortality child mortality is somewhat higher in indigenous populations than it
higher in indigenous populations than it
higher in indigenous populations than it is in the majority populations and –
is in the majority populations and –
is in the majority populations and – this is because lack of proper access to
this is because lack of proper access to
this is because lack of proper access to health care it’s not much higher but it
health care it’s not much higher but it
health care it’s not much higher but it is higher in all these 3 indigenous
is higher in all these 3 indigenous
is higher in all these 3 indigenous populations so – men too much or too
populations so – men too much or too
populations so – men too much or too little integration ok we looked at
little integration ok we looked at
little integration ok we looked at high-income countries now let’s take a
high-income countries now let’s take a
high-income countries now let’s take a look at upper middle income countries
look at upper middle income countries
look at upper middle income countries and I’ll keep the US as a reference and
and I’ll keep the US as a reference and
and I’ll keep the US as a reference and for upper middle income countries
for upper middle income countries
for upper middle income countries I choose Romania instead of China
I choose Romania instead of China
I choose Romania instead of China because Romania has a minority that has
because Romania has a minority that has
because Romania has a minority that has become quite well-known to us here in
become quite well-known to us here in
become quite well-known to us here in Sweden Romania has the Roma as a
Sweden Romania has the Roma as a
Sweden Romania has the Roma as a minority and the Roma they constitute
minority and the Roma they constitute
minority and the Roma they constitute about 3% of the Romanian population many
about 3% of the Romanian population many
about 3% of the Romanian population many of the Roma
of the Roma
of the Roma if you have in search of a better life
if you have in search of a better life
if you have in search of a better life come to Sweden so therefore they’re
come to Sweden so therefore they’re
come to Sweden so therefore they’re quite well-known to us so how is life
quite well-known to us so how is life
quite well-known to us so how is life expectancy for the Roma let me first
expectancy for the Roma let me first
expectancy for the Roma let me first tell you it’s not easy to find date on
tell you it’s not easy to find date on
tell you it’s not easy to find date on these things that’s my job I try to find
these things that’s my job I try to find
these things that’s my job I try to find data every day for different types of
data every day for different types of
data every day for different types of health statistics but when it comes to
health statistics but when it comes to
health statistics but when it comes to looking for minorities it’s not easy and
looking for minorities it’s not easy and
looking for minorities it’s not easy and why is that is it because governments
why is that is it because governments
why is that is it because governments don’t want to know well in some cases
don’t want to know well in some cases
don’t want to know well in some cases maybe yes but also to collect data on
maybe yes but also to collect data on
maybe yes but also to collect data on minorities the person who identifies as
minorities the person who identifies as
minorities the person who identifies as belonging to a minority must also report
belonging to a minority must also report
belonging to a minority must also report that he belongs to this minority when
that he belongs to this minority when
that he belongs to this minority when the data is collected and in many cases
the data is collected and in many cases
the data is collected and in many cases this is not happening so it’s it’s quite
this is not happening so it’s it’s quite
this is not happening so it’s it’s quite a lot of underreporting going on
a lot of underreporting going on
a lot of underreporting going on you know Romania has a life expectancy
you know Romania has a life expectancy
you know Romania has a life expectancy of 75 the Roma about 10 years less
reflecting all the social or the
reflecting all the social or the cultural or the educational differences
cultural or the educational differences
cultural or the educational differences between the Roma population and the
between the Roma population and the
between the Roma population and the majority population in Romania what
majority population in Romania what
majority population in Romania what about lower middle income countries here
about lower middle income countries here
about lower middle income countries here we go for India and in India there are
we go for India and in India there are
we go for India and in India there are so many different minorities and
so many different minorities and
so many different minorities and hundreds of them and they actually call
hundreds of them and they actually call
hundreds of them and they actually call themselves a lot of them they belong to
themselves a lot of them they belong to
themselves a lot of them they belong to something called scheduled tribes and
something called scheduled tribes and
something called scheduled tribes and sometimes when we talk about tribes we
sometimes when we talk about tribes we
sometimes when we talk about tribes we think that that’s something of the past
think that that’s something of the past
think that that’s something of the past colonial but this is the official name
colonial but this is the official name
colonial but this is the official name scheduled tribes there are big scheduled
scheduled tribes there are big scheduled
scheduled tribes there are big scheduled tribes like the Gujarati with several
tribes like the Gujarati with several
tribes like the Gujarati with several million people belonging to them and
million people belonging to them and
million people belonging to them and there are small scheduled tribes with
there are small scheduled tribes with
there are small scheduled tribes with only a few hundred members and the life
only a few hundred members and the life
only a few hundred members and the life expectancy of the scheduled tribes is
expectancy of the scheduled tribes is
expectancy of the scheduled tribes is not that low actually it’s about
not that low actually it’s about
not that low actually it’s about comparing to India which is 67
comparing to India which is 67
comparing to India which is 67 it’s about 63 to 64 so 3 to 4 years less
it’s about 63 to 64 so 3 to 4 years less
it’s about 63 to 64 so 3 to 4 years less and I did not find when I looked through
and I did not find when I looked through
and I did not find when I looked through all the data I did not find any country
all the data I did not find any country
all the data I did not find any country with a life expected to lower the life
with a life expected to lower the life
with a life expected to lower the life and then finally let’s go to low-income
and then finally let’s go to low-income
and then finally let’s go to low-income countries
countries
countries and look at Congo the Democratic
and look at Congo the Democratic
and look at Congo the Democratic Republic of Congo and I choose Congo
Republic of Congo and I choose Congo
Republic of Congo and I choose Congo Congo is close to my heart
Congo is close to my heart
Congo is close to my heart I worked there as a doctor as of several
I worked there as a doctor as of several
I worked there as a doctor as of several years ago and I really got to see with
years ago and I really got to see with
years ago and I really got to see with my own eyes
my own eyes
my own eyes the reason why the life expectancy in
the reason why the life expectancy in
the reason why the life expectancy in Congress only 58 we have a high maternal
Congress only 58 we have a high maternal
Congress only 58 we have a high maternal mortality mother’s die it’s horrible
mortality mother’s die it’s horrible
mortality mother’s die it’s horrible mother’s side children die from diseases
mother’s side children die from diseases
mother’s side children die from diseases that are easily treatable life
that are easily treatable life
that are easily treatable life expectancies 58 in Congo there are also
expectancies 58 in Congo there are also
expectancies 58 in Congo there are also many many many minorities and some of
many many many minorities and some of
many many many minorities and some of them live in the rainforest one of them
them live in the rainforest one of them
them live in the rainforest one of them is a group called the FF pygmies or the
is a group called the FF pygmies or the
is a group called the FF pygmies or the FE people and the life expectancy now
FE people and the life expectancy now
FE people and the life expectancy now we’re not talking about data now we’re
we’re not talking about data now we’re
we’re not talking about data now we’re talking about expect of estimations or
talking about expect of estimations or
talking about expect of estimations or observations of people who have lived
observations of people who have lived
observations of people who have lived with Fe pygmies it’s one somewhere down
with Fe pygmies it’s one somewhere down
with Fe pygmies it’s one somewhere down here I think actually it’s rather down
here I think actually it’s rather down
here I think actually it’s rather down there but I couldn’t fit that into my
there but I couldn’t fit that into my
there but I couldn’t fit that into my graph so it’s here it’s probably about
graph so it’s here it’s probably about
graph so it’s here it’s probably about 30 to 35 so more than 20 years less than
30 to 35 so more than 20 years less than
30 to 35 so more than 20 years less than the life expectancy of Congo so now that
the life expectancy of Congo so now that
the life expectancy of Congo so now that we have this is my final graph now that
we have this is my final graph now that
we have this is my final graph now that we have it all in front of us what
we have it all in front of us what
we have it all in front of us what conclusions can we draw but can we see
conclusions can we draw but can we see
conclusions can we draw but can we see when we have this in front of us well
when we have this in front of us well
when we have this in front of us well first of all if we take a look at the
first of all if we take a look at the
first of all if we take a look at the countries the high-income countries and
countries the high-income countries and
countries the high-income countries and the upper middle income countries we see
the upper middle income countries we see
the upper middle income countries we see that we have these big differences
that we have these big differences
that we have these big differences between minority and majority
between minority and majority
between minority and majority populations with up to ten years
populations with up to ten years
populations with up to ten years difference in life expectancy right you
difference in life expectancy right you
difference in life expectancy right you can also say that it seems like in lower
can also say that it seems like in lower
can also say that it seems like in lower middle-income countries these
middle-income countries these
middle-income countries these differences are not as big because most
differences are not as big because most
differences are not as big because most people have access to basic health care
people have access to basic health care
people have access to basic health care and going to school when taking in just
and going to school when taking in just
and going to school when taking in just an example at least there are still
an example at least there are still
an example at least there are still differences but they’re not as big here
differences but they’re not as big here
differences but they’re not as big here the majority populations have access to
the majority populations have access to
the majority populations have access to the best form of health care and then we
the best form of health care and then we
the best form of health care and then we have a life expectancy like this and
have a life expectancy like this and
have a life expectancy like this and finally the life expectancy of the F
finally the life expectancy of the F
finally the life expectancy of the F epidemy is 30 to 35
epidemy is 30 to 35
epidemy is 30 to 35 sometimes we tend to talk about these
sometimes we tend to talk about these
sometimes we tend to talk about these but people living in the rainforest as
but people living in the rainforest as
but people living in the rainforest as we’d romanticize they live in ecological
we’d romanticize they live in ecological
we’d romanticize they live in ecological balance with the nature it’s fantastic
balance with the nature it’s fantastic
balance with the nature it’s fantastic let me take a look at this and what you
let me take a look at this and what you
let me take a look at this and what you see is that they do not live in
see is that they do not live in
see is that they do not live in ecological balance with nature at the
ecological balance with nature at the
ecological balance with nature at the diary like illogical balance with nature
diary like illogical balance with nature
diary like illogical balance with nature child mortality of 40% more than half
child mortality of 40% more than half
child mortality of 40% more than half sometimes of the children do not ever
sometimes of the children do not ever
sometimes of the children do not ever reach adult age so that we also can
reach adult age so that we also can
reach adult age so that we also can maybe not see in this picture but what
maybe not see in this picture but what
maybe not see in this picture but what we know from history is that all the
we know from history is that all the
we know from history is that all the countries in the lower middle upper
countries in the lower middle upper
countries in the lower middle upper middle and high-income countries what
middle and high-income countries what
middle and high-income countries what they have done is that as they have
they have done is that as they have
they have done is that as they have become richer and healthier they have
become richer and healthier they have
become richer and healthier they have taken the minorities with them so the
taken the minorities with them so the
taken the minorities with them so the health of the minorities have become
health of the minorities have become
health of the minorities have become better at the same time as the health of
better at the same time as the health of
better at the same time as the health of the majority populations and actually as
the majority populations and actually as
the majority populations and actually as the countries have become richer the gap
the countries have become richer the gap
the countries have become richer the gap has become smaller and there is no
has become smaller and there is no
has become smaller and there is no example of a country that first achieved
example of a country that first achieved
example of a country that first achieved perfect equal health for everyone and
perfect equal health for everyone and
perfect equal health for everyone and then started to rise all these countries
then started to rise all these countries
then started to rise all these countries have been raised a rising with some
have been raised a rising with some
have been raised a rising with some people having a higher better health and
people having a higher better health and
people having a higher better health and some people having lower health but
some people having lower health but
some people having lower health but raising rising together and my take-home
raising rising together and my take-home
raising rising together and my take-home message is I would like you to keep two
message is I would like you to keep two
message is I would like you to keep two thoughts in your mind at the same time
thoughts in your mind at the same time
thoughts in your mind at the same time if you can do that first of all it’s
if you can do that first of all it’s
if you can do that first of all it’s horrible that we have these 10 year
horrible that we have these 10 year
horrible that we have these 10 year different system there are differences
different system there are differences
different system there are differences between minorities and majorities
between minorities and majorities
between minorities and majorities they’re still there they’re there
they’re still there they’re there
they’re still there they’re there they’re clear you’ve seen them but there
they’re clear you’ve seen them but there
they’re clear you’ve seen them but there is no minority in all these three income
is no minority in all these three income
is no minority in all these three income groups that has a lower life expectancy
groups that has a lower life expectancy
groups that has a lower life expectancy than the average life expectancy of
than the average life expectancy of
than the average life expectancy of low-income countries than the average
low-income countries than the average
low-income countries than the average don’t forget the low-income countries so
don’t forget the low-income countries so
don’t forget the low-income countries so keep this spectrum in your in your heads
keep this spectrum in your in your heads
keep this spectrum in your in your heads and that will make my day as a teacher
and that will make my day as a teacher
and that will make my day as a teacher thank you very much
thank you very much
thank you very much [Applause]
”
Be First to Comment